
Setting up remote log streaming for Compute
- English
- 日本語
Logs provide an important resource for troubleshooting connectivity problems, pinpointing configuration areas that could use performance tuning, and identifying the causes of service disruptions. We recommend setting up remote log streaming when you start using Fastly services.
Compute gives you multiple options for streaming logs. The quickest way to get started with logging is to use our log tailing feature, which lets you stream custom log messages from your Compute application to your local console. You can also configure Fastly's Real-Time Log Streaming feature to automatically save logs to a third-party service for storage and analysis. You can take advantage of these logging options separately or together.
NOTE: Fastly does not provide direct support for third-party services. Read Fastly's Terms of Service for more information.
IMPORTANT: Be sure to take into account security, privacy, and compliance requirements when making configuration and endpoint decisions for the data you intend to include in streamed logs.
How logs are streamed
Fastly uses several different log-server aggregation points and each will send logs files, none of which contain duplicate entries. These log files are created as soon as streaming starts and they're written to over the entire time period you specify (or the default). Once that time has passed, the files aren't touched any more and the logging process creates a new batch of files.
The number of log-server aggregation points may change over time in line with our capacity requirements. If you're sending logs to a storage endpoint and are concerned about the number of log files that will be created on your disk, consider choosing a logging endpoint that supports real-time ingestion, which will eliminate a need for pre-processing log files.
Configuring logging via log-tailing
The quickest way to try out logging with Compute is to use our log-tailing feature. Log tailing can be used to display output from stdout and stderr directly on your local console and doesn't require any third-party integrations or endpoints. This is useful for testing and debugging your code.
Testing and debugging on Compute has instructions on how to live-tail a service using one of our Compute starter kits.
Configuring logging via third-party endpoints
Another way to configure logging on Compute is to configure one or more third-party logging endpoints. Before setting up remote log streaming, keep the following in mind:
- Be sure to double-check the delivery formats required by your logging provider and what you're delivering to them. Some providers have strict formatting requirements for the formats they allow (e.g., JSON).
- If you configure multiple logging endpoints for your service, logs will be sent to all of the logging endpoints.
Follow these instructions to access the logging settings:
- Log in to the Fastly control panel.
- From the Home page, select the appropriate service. You can use the search box to search by ID, name, or domain.
- Click Edit configuration and then select the option to clone the active version.
Click Logging. If you've already added a logging endpoint, click Create Endpoint. The list of available logging endpoints appears.
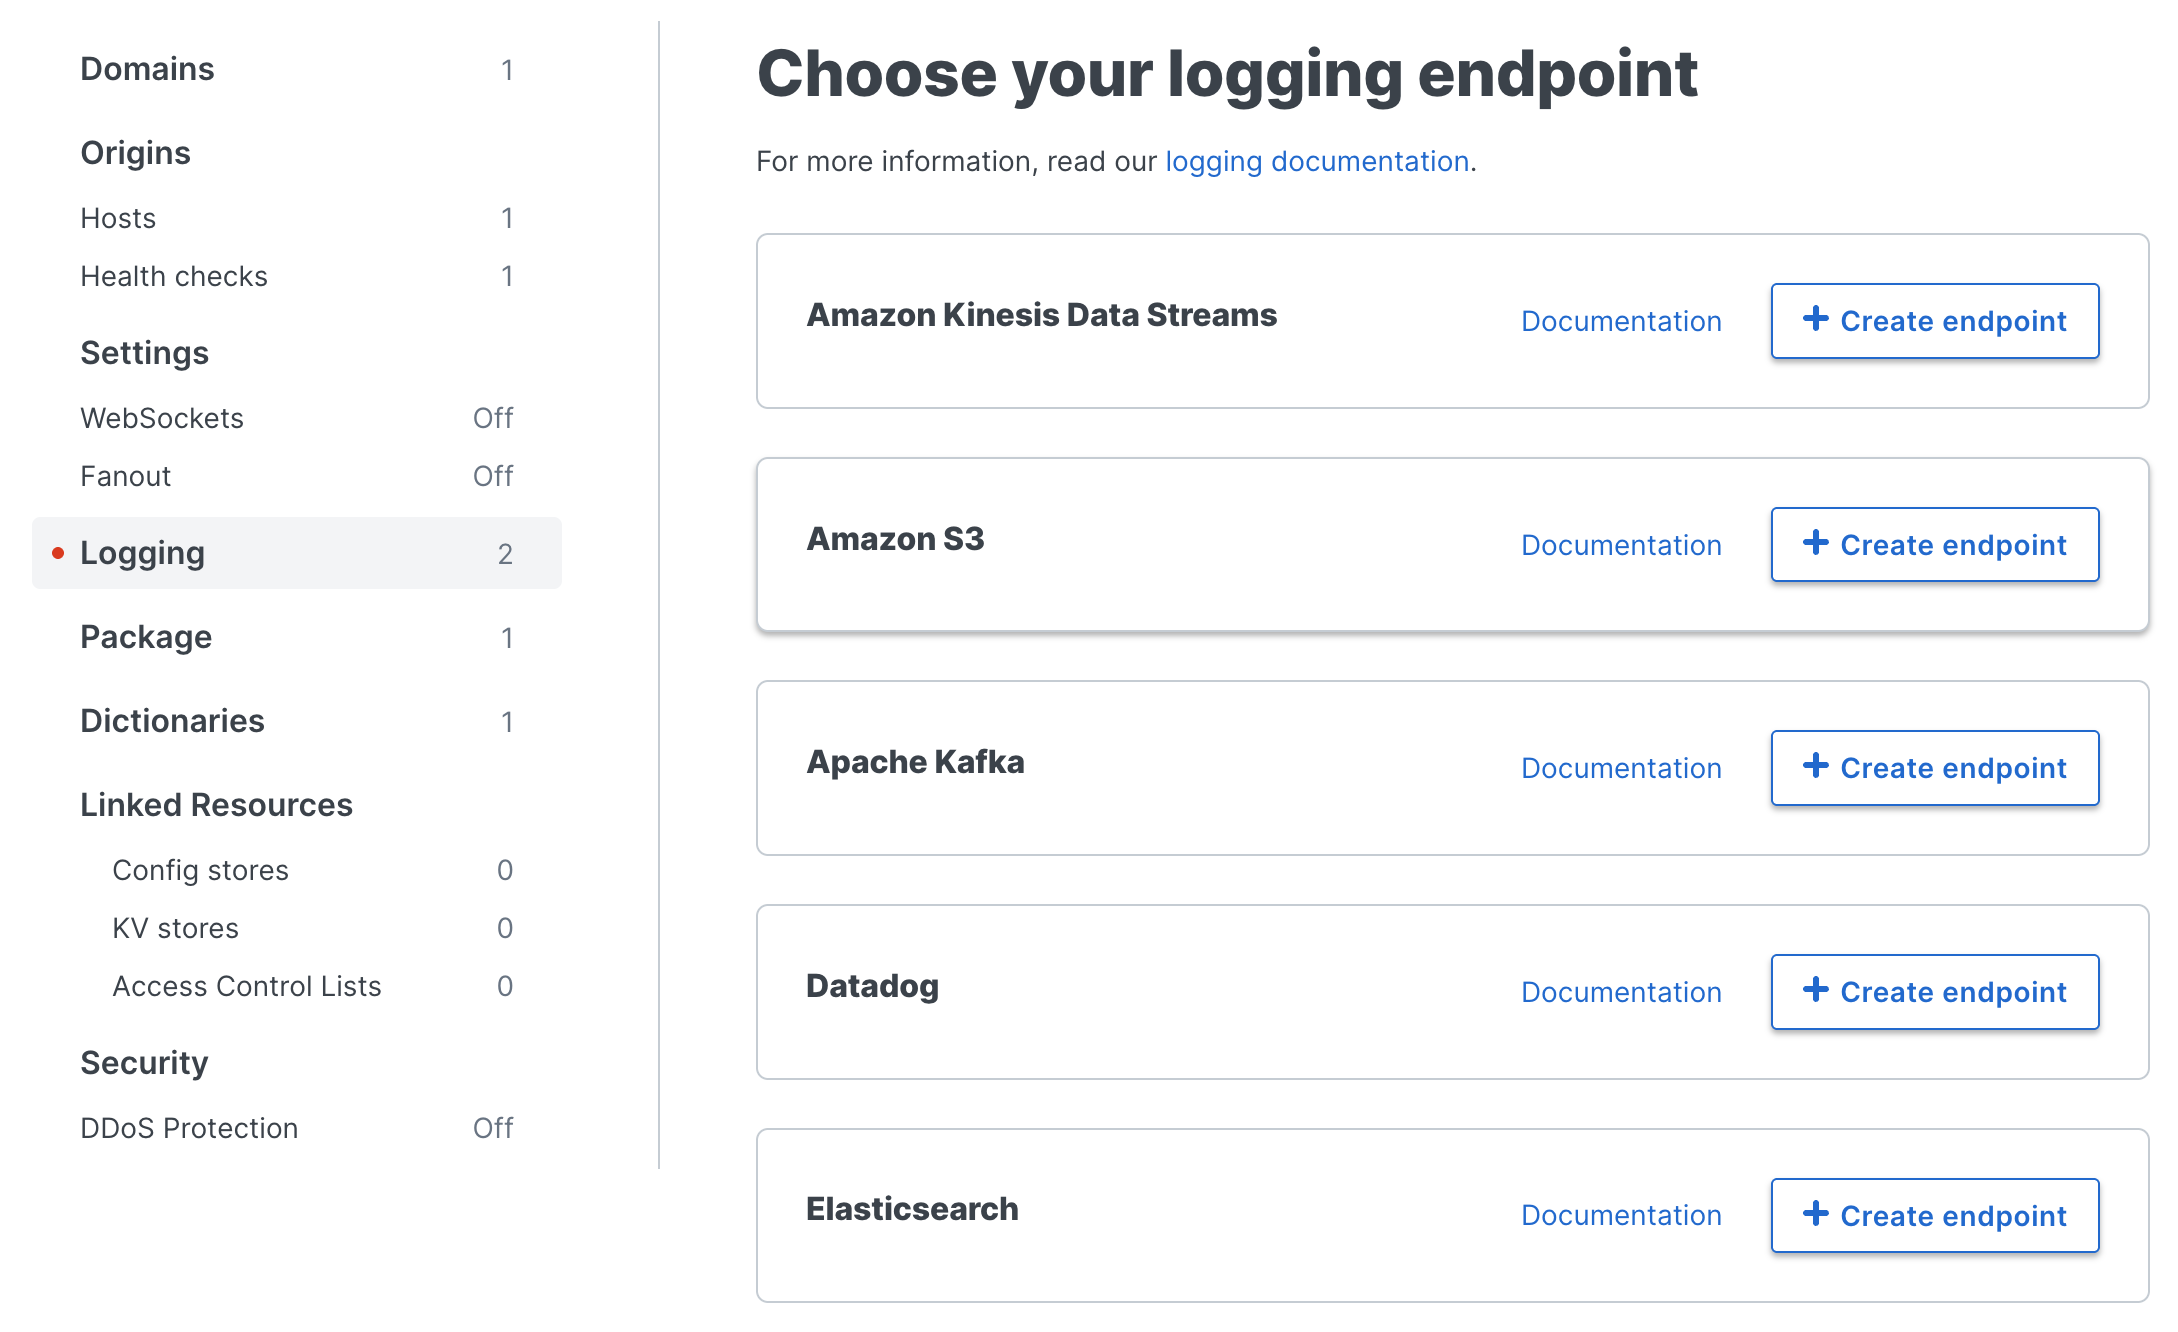
Follow the instructions in one of our logging endpoint guides to complete the set up process and deploy your changes.
Once you've clicked Activate to deploy your changes, events will begin being logged immediately. The logs may take a few moments to appear on your log server.
Advanced logging configuration
Depending on the starter kit you're using, there may be advanced configuration capabilities to give you more precise control of your log data. For example, the log_fastly crate in Rust has an option to integrate log tailing with your third-party logging endpoint, define a default endpoint for different logging levels, and support multiple logging endpoints. Advanced configuration capabilities are also possible with JavaScript and GO.
An example using Rust
The following example demonstrates how to format log data as JSON to send to a third party endpoint. It is based on the default starter kit for Rust.
In this example, we have configured an endpoint named my_endpoint that expects a JSON object like:
{ "client_ip": "127.0.0.1", "host": "firstly-coral-feather", "request_method": "GET", "timestamp": "2022-09-22 17:30:17.225185 UTC", "trace_id": "cffc6f9a6b0645ad89adc569c99e91aa", "url": "https://firstly-coral-feather/"}To format log data as JSON, we add serde_json as a dependency in the Cargo.toml file along with Chrono for timestamp data.
[dependencies]fastly = "0.8.7"log-fastly = "0.8.7"log = "0.4.17"chrono = "0.4"serde_json = "1.0.85"Then, we modify the src/main.rs file from the starter kit:
//! Compute logging demouse fastly::http::{header, Method, StatusCode};use fastly::{mime, Error, Request, Response};use serde_json::json;#[fastly::main]fn main(req: Request) -> Result<Response, Error> { // Filter request methods... match req.get_method() { // Allow GET and HEAD requests. &Method::GET | &Method::HEAD => (), // Deny anything else. _ => { return Ok(Response::from_status(StatusCode::METHOD_NOT_ALLOWED) .with_header(header::ALLOW, "GET, HEAD") .with_body_text_plain("This method is not allowed\n")) } }; // Pattern match on the path... match req.get_path() { // If request is to the `/` path... "/" => { // Initialize the logger with the one endpoint // Notice we are echoing to stdout, so we don't need separate println! for log-tailing log_fastly::Logger::builder() .max_level(log::LevelFilter::Info) .default_endpoint("my_endpoint") .echo_stdout(true) .init(); // Get some request data to log let ts = chrono::Utc::now(); let record = json!({ "timestamp": ts.format("%F %T%.6f %Z").to_string(), "trace_id": std::env::var("FASTLY_TRACE_ID").unwrap_or_else(|_| String::new()), "client_ip": req.get_client_ip_addr().unwrap().to_string(), "host": req.get_header_str("Host"), "request_method": req.get_method_str(), "url": req.get_url_str(), }); // Send the logs // note we didn't specify a target so it goes to `my_endpoint`, which we set as the default // We could have also specified the target log::info!(target: "my_endpoint", "{}", record.to_string()) log::info!("{}", record.to_string()); // Send a default synthetic response. Ok(Response::from_status(StatusCode::OK) .with_content_type(mime::TEXT_HTML_UTF_8) .with_body(include_str!("welcome-to-compute@edge.html"))) } // Catch all other requests and return a 404. _ => Ok(Response::from_status(StatusCode::NOT_FOUND) .with_body_text_plain("The page you requested could not be found\n")), }}Once ready, build and deploy the service and tail the service to see the logging output in your developer console.
Troubleshooting common logging errors
When your logging configuration displays errors, use the Endpoint Error Stream to investigate and diagnose the problem.
