Fastly’s real-time logging is a best-in-class solution for enterprise-scale log distribution from edge applications to customer-defined log storage destinations. However, creating, configuring, and paying for additional third-party log management services, isn’t always optimal for quick ad-hoc debugging of edge applications during development stages.
To solve this, we first introduced live log-tailing to our Fastly CLI to provide customers and developers with real-time log streaming capabilities and visibility into Compute services, right from their development environments.
The Fastly CLI is an excellent tool during development and debugging, when an engineer is typically working within the codebase and command line. But it may not always be the most readily available tool when you’re viewing observability metrics and dashboards in the browser. Our new C@E Log-Tailing UI solves this problem.
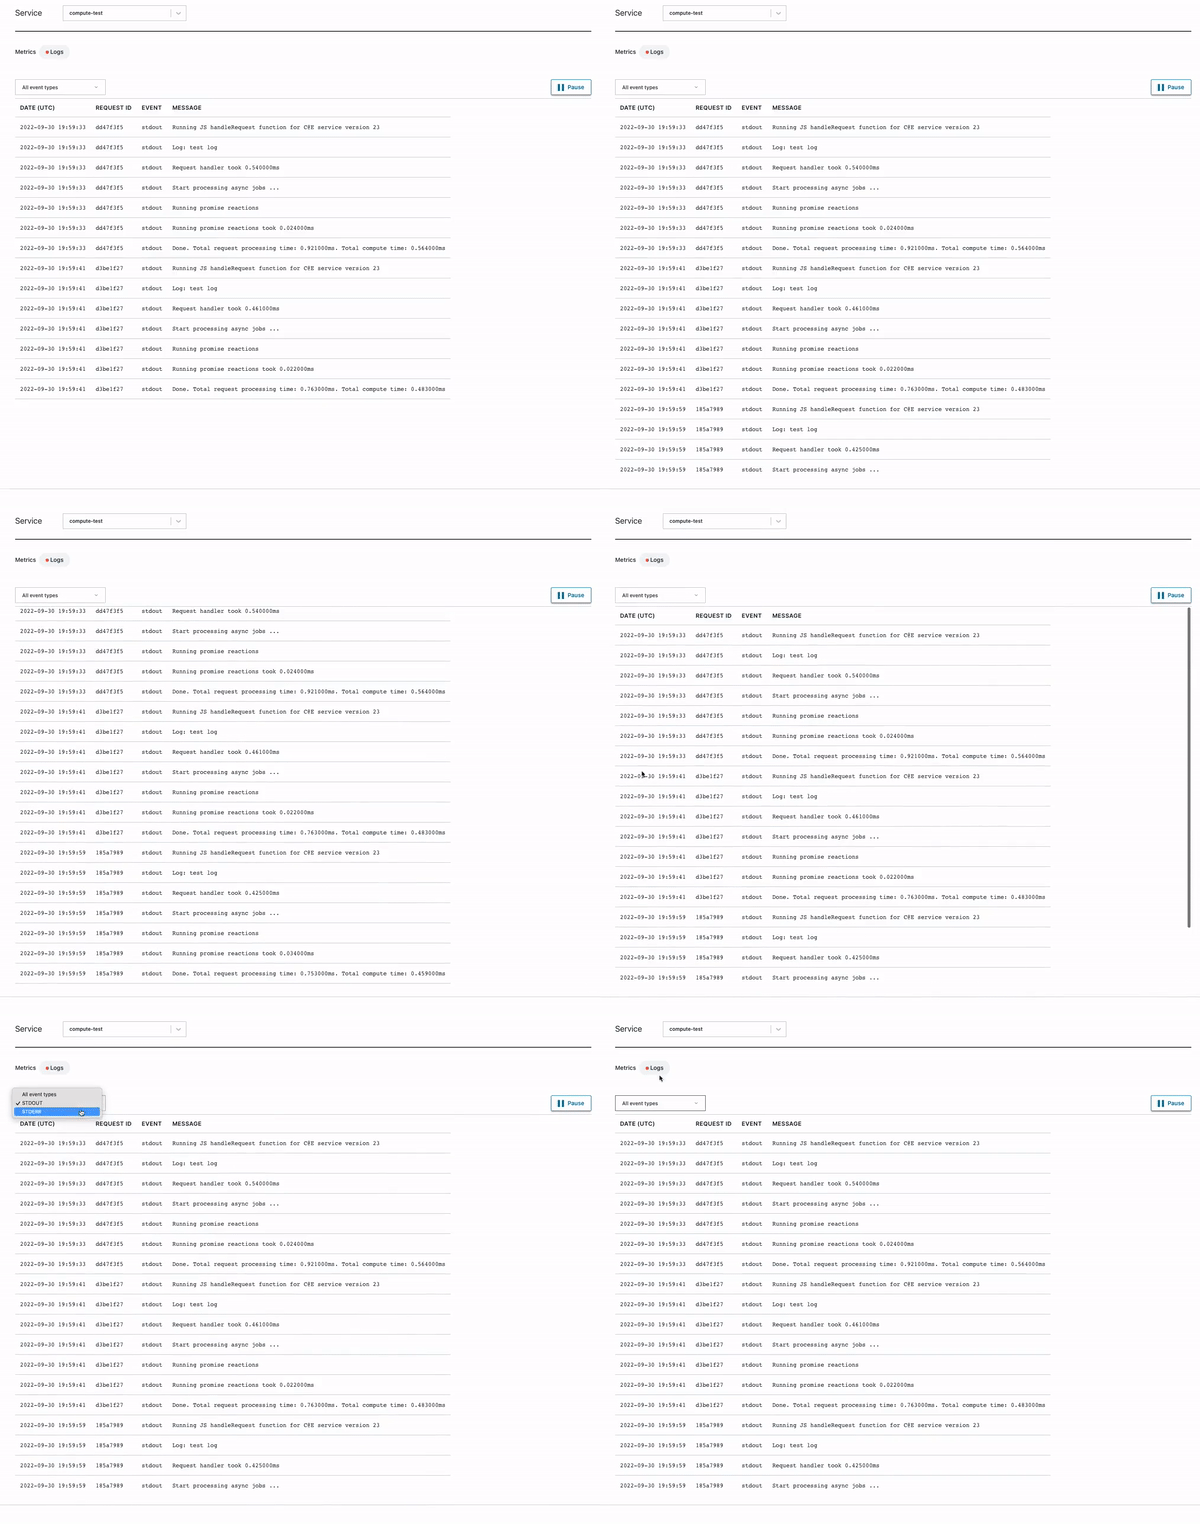
Now you can access live log data, right alongside critical service metrics and dashboards in the Fastly UI and just a click away from the real-time and historical metrics you’re used to.
The Log-Tailing UI is available as part of our Edge Observer (Beta) – the new entry point to understand and monitor the health and performance of all your Fastly services. Edge Observer provides custom dashboards, real-time and historical views, side by side metric comparisons, all with the intent of becoming a one-stop observability tool across all Fastly services.
Check it out!

Filter between “stdout” and “stderr” logs
Pause or resume the live stream of logs
View logs and metrics within the same interface
Interested in giving it a try?
Reach out to us at support@fastly.com and become a participant in our Edge Observer (Beta) product to gain access to this new log-tailing UI feature!
